Cyclical time influence on differences with conversion results
When you start observing your analytics’ stats, you can sometimes observe that some variables are quite different, dependently on the day you look at. If you do some changes, or introduce a new marketing campaign, it is OK – it explains why is it so. But why sometimes the differences could be high, even if you don’t do any changes? And how to predict them?
Primarily, you need to answer to the following questions concerning number of visitors:
- Why and when do the visitors visit your website?
- What can influence them not to visit it? Any external, internal factors?
- Can you see any regularity why do they visit your websites or not (in particular days of month, of week, day time, etc)?
… and also behavior, dependent on the rush-hours or off-peak, weekdays and weekends, etc:
- Do they have similar objectives when visiting your websites?
- Even if so, do they have the same amount of time? Probably not, so – what actions do they do, and what do they omit?
- Can you describe the preferences of your customer groups, dependently on the time they visit the website?
Even if you answer to these questions, you frequently cannot explain all the deviations that you can see in your reports. However, you can base on several schemes, that could help you with catching the possible areas. One of the answers is presented below, from my former researches.

Please take a look at the picture above. The blue curve describes the number of goals achieved (in this case: number of registrations), and the orange one means the ratio: visitors vs goals. These stats comes from a community website for students, and represent basis of Mon-Fri learning. That influence a big drop in Fridays and Saturdays, as well as days before national holidays, etc.
When you analyze these two, correlating factors, you can see that once a week (sometimes twice) there is a clear peak. It is usually Sunday. The visitors are not only browsing the website, but also registering more frequently. On the other hand, on Mondays, there is a big drop of conversion rate (of goals achieved vs. number of visitors), but only a slight decrease in number of absolute goals. It can be explained by several different reasons, like lack of time, or different assignments, etc. However, the implication is obvious: on Mondays, users are less eager to register on the website.
Implications and conclutions:
However the range of possible kinds of websites, target users, as well as preferences and time influence, may vary greatly, there are several overall implications for taking advantage of statistical tools when measuring web performance:
- do not assess effects of changes (external or internal) without taking into consideration the time influence issue
- if you update your content frequently, think about changing your “daily special offer” dependently on users’ preferences in that particular day (eg. give big-deal-packages on Sundays, but quick-shopping on Mondays)
- do not assume that your visitors have the same needs and behaviors every time they visit your website; as well as do not claim that users with different behaviors are different persons – it is not so obvious
- if you can, use tools such as Google Website Optimizer to test different versions in real time
In contacts section, you can find ways you can approach me, if you need any consultancy specific to your business.
Embedded video isn’t just a multimedia stuff. It is a consistent part of your website architecture.
One of my first illustrated observation concerning decreasing bounce rate was a research done at publishing website, with different kind of articles, photos, forums, videos, and other materials prepared of broad target group. Analytics tools told that quite high number of users visits pages with embedded videos. These pages have been “packed” by standard menus, logos, tag-clouds and bunch of different general links by the top, left, and right. However, bounce rate was very high – above 76%. It meant that only one-forth of users were able to find any interesting link to another page within this website.
The reason was pretty obvious. The major area of content looked like at this scheme:
That was all. No hyperlinks, no buttons, no forms just below this video. A solution to check was pretty obvious – finding a similar video and cross-linking to it. It would give the user a next step, a call for further action. So I have just written a short sentence and given a hyperlink, like that: Eventually, the overall effect has given to the user a simple object plus an obvious next step element. It has looked still very simple, but design was complete to give the user easy possibility to stay at the website.
 Such version has been left at the website for a month, that the results would be reliably compared to previous version. After a month bounce rate would be compared.
Results
It was expected that exit rate should drop, as well as bounce rate (since the visitors were in general new visitors, coming from organic Google results). I expected also that a time spent per visitor on page would decrease slightly, as a clear “next step” action allow users to limit her searching for possible links to click on.
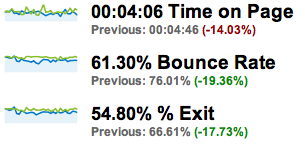
In fact, these expectations met the results. Bounce rate dropped from 76% to 61%, exit rate from 67% to 55%, and (the side effect) the time on page from 4m 46s to 4m 6s. These results are presented at screen below: It is important to make a few calculations and implications, based on these numbers, though.
First, as the drop of bounce rate by 19,36% seems to be very positive, the real value is seen from the number of kept users. To count it, we simply need to deduct bounce rate from total (100%) to see the number of people that stayed at the website. Primarily it was only 24% (100%-76%), and after the changes it was increased to 39%. Growth from 24% to 39% means that we increased the previous results by more than 50%! And it is done only by one simple sentence with a link.
Another observation that could be made, is that such change has had better effect on new visitors than those who has previously browsed other pages on the website during their session. It means that, especially for new visitors, such a simple next step is really important. This observation can be, thus, applied with greater effects on those websites that have high number of new visitors.
Last observed parameter, avg. tim per session, has dropped, but in a smaller dimension, that observed growth of bounce rate and exits decrease. It means that, although for this particular page the time has dropped, for whole website it probably has increased.
Most important indicators measuring web performance
Before I start sharing results of my researches, I’d like to explain my approach, why I have chosen particular areas of measurement. Primarily, each and every website serves one or several, clearly defines goals. This is obvious, but at the same time, usually people responsible for the websites don’t really focus on the most important objectives, trying to challenge too much of them.
There are several different major kinds of websites, that are characterized by common set of objectives. They could be divided as follows:
- e-commerce – must lead to (direct) sales of a product of service
- corporate / personal website – building image, and (should be) leading to contact details
- publishers’ / community website – monetization through ads, so leads are mainly registration or maximizing avg. views per session
All of them has several common factors determining quality of performance – apart from simple number of visitors, there are indicators explaining both relevancy of users and quality of web interface architecture & design. They can be measured mainly through number of goals achieved (that is, percentage of visitors, that performed expected action, usually sending fulfilled (order/contact/registration form), a funnel of a way that is necessary to achieve the goal (like finding a product, adding it to a basket, fulfilling order form, and sending it), as well as number of exits and bounce rate.
First, number of goals achieved can tell us, what’s the basic rentability of a website. That is, if we pay EUR 0,50 per click to attract a visitor, and 5% of our visitors realize a goal in a shape of order of EUR 100, including EUR 10 of our margin, it means that for becoming a profitable venture, we need to:
- increase prices/margin (-> overall business performance and operations, sales and procurement strategy)
- lower the costs of advertising (-> marketing and advertisement optimization)
- increase the customer/visitor ratio (-> internal web performance optimization)
All three above issues are very interesting, but I primarily focus on the last aspect. As the number of goals gives only a picture whether a business is or is not profitable, major focus should be made on explanations why is it so.
Starting with issues with the highest effects vs. costs ratio, I would focus primarily on first impression of the user. It can be measured by number of exit rate, and especially by bounce ratio. This indicator explains what is the number of visitors, who see only one page of your website – that is, they are exiting website, just after entering it, without any interaction. High bounce rate means that either these visitors aren’t correctly targeted (they’re not interested in your product/offer), or your website isn’t designed efficiently. Or both.
As targeting visitors is an external issue (connected with marketing optimization), I’ll dig into it much later. However, frequently even only introducing small changes to website architecture, can bring great results. My first researchers proved that adding properly only one line of simple text with a hyperlink, can keep 20% or more visitors at your website.
I’ll present details in the next posts.
Optimization of web performance – first researches and my approach
I have decided to start publishing this blog, as I have gathered some information about good practices, increasing website performance. First, I put my interest in bounce rate decreasing, as well as keeping user longer at the website. In the near future, I will broaden a range of my researches to increasing achieving goals, such as filling the form, registering, sales, etc.
Naturally, I use Google Analytics in my researches and websites that I am testing are primarily my own, or such that I am connected in any way. I will increase range of researched places as the time goes by. If any of the readers would like me to help with your website optimization, please contact me, as currently I will be eager to test as much different kind of websites as possible, to use and verify already developed know-how, as well well find out new solutions and good practices. During my research, my consultancies and works are free of charge.
In following posts, I will put some of my know-how, already tested, analyzed, and described. As such process is usually time-consuming, please don’t expect overload of fast-published analyses.
1 comment